Elastic Stack Architecture for Scalable Log Analytics
Introduction
In modern IT operations, the volume of log data generated by applications, containers, and infrastructure can quickly overwhelm traditional monitoring tools. A well designed Elastic Stack architecture offers a unified pipeline that ingests, enriches, stores, and visualizes logs at scale, enabling teams to detect issues, meet compliance requirements, and derive business insights.
Core Concept
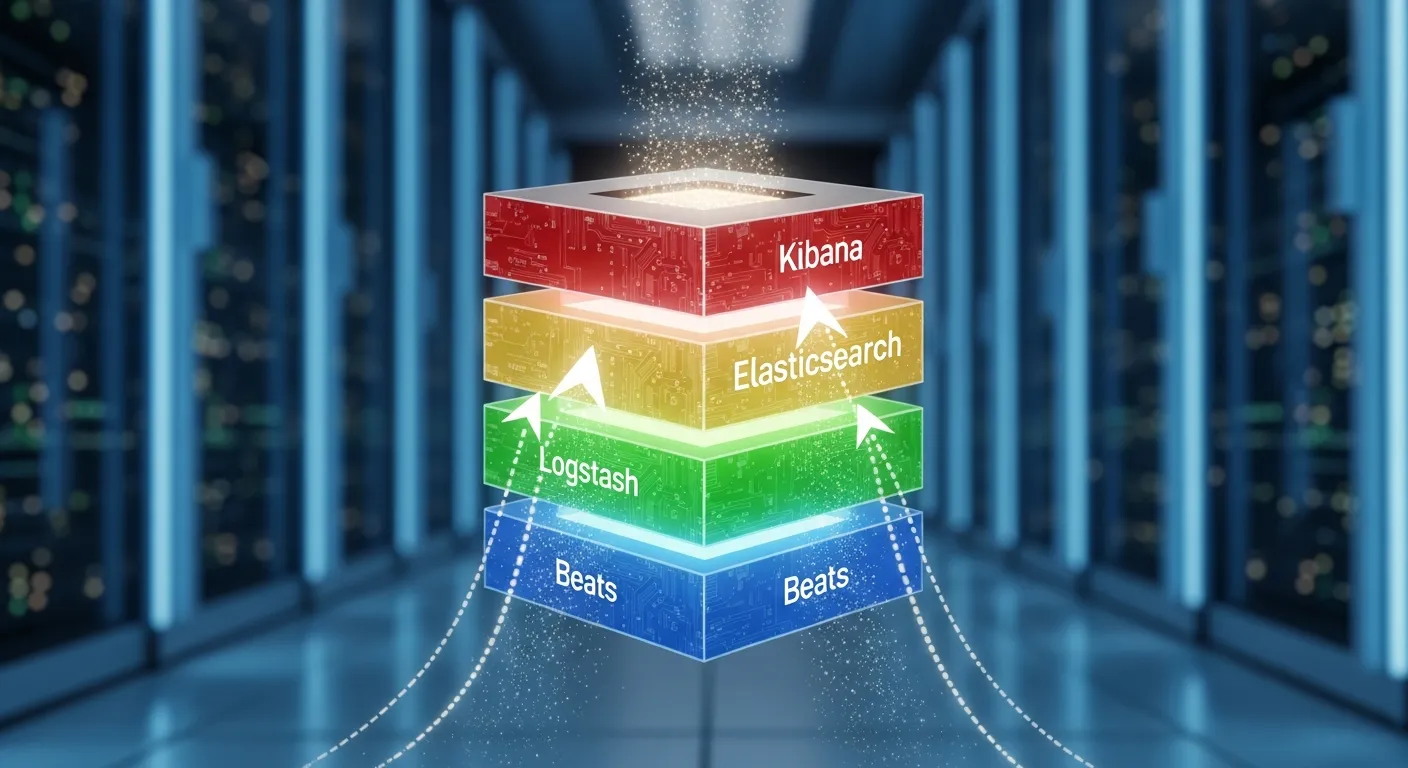
The core concept of the Elastic Stack is a decoupled, data‑centric pipeline where Beats collect raw logs, Logstash transforms and routes them, Elasticsearch indexes the structured events, and Kibana provides interactive exploration. This separation of concerns allows each layer to be scaled independently based on workload characteristics.
Architecture Overview
A typical scalable deployment consists of multiple data ingestion zones, a distributed Elasticsearch cluster, dedicated coordinating nodes, and a set of Kibana instances behind a load balancer. Beats run on edge hosts, sending data to regional Logstash fleets that perform parsing, enrichment, and throttling. The processed events flow into Elasticsearch shards that are replicated across data nodes for high availability. Kibana reads from the cluster and serves dashboards to end users.
Key Components
- Beats
- Logstash
- Elasticsearch
- Kibana
- Coordinating nodes
- Data nodes
- Ingest pipelines
- Load balancer
How It Works
When a log line is generated, a Beat agent captures it and forwards the payload over TLS to the nearest Logstash instance. Logstash applies filters such as grok, dissect, or geo‑ip, adds metadata like host tags, and routes the event to one or more Elasticsearch pipelines. Elasticsearch indexes the document into a time‑based index, automatically managing shard allocation and replica placement. Kibana queries the cluster using the REST API, rendering visualizations that refresh in near real time.
Use Cases
- Infrastructure monitoring for cloud native microservices
- Security information and event management (SIEM)
- Application performance troubleshooting
- Compliance audit log retention
- Business intelligence from event‑driven data
Advantages
- Horizontal scalability through shard distribution
- Schema‑free JSON storage enables flexible log formats
- Rich query DSL and full‑text search capabilities
- Extensible pipeline with hundreds of Logstash plugins
- Unified UI for dashboards, alerts, and machine learning
Limitations
- Memory intensive indexing can increase infrastructure cost
- Complex cluster tuning required for very high ingest rates
- Retention policies must be managed to avoid storage bloat
Comparison
Compared to legacy syslog servers, the Elastic Stack provides real time search, distributed scaling, and powerful visualizations. Against commercial SIEM platforms it offers lower licensing cost and greater extensibility, though it may require more operational expertise to tune performance and security settings.
Performance Considerations
Key performance levers include shard sizing, refresh interval tuning, ingest node scaling, and JVM heap allocation. Using index lifecycle management to roll over hot indices and freeze warm indices reduces segment count. Bulk indexing with optimal batch sizes and compression settings can improve throughput while minimizing network overhead.
Security Considerations
Secure the pipeline with TLS for beat‑to‑logstash and logstash‑to‑elasticsearch communication. Enable role‑based access control in Elasticsearch and Kibana, enforce audit logging, and isolate clusters with dedicated VPCs or subnets. Regularly rotate certificates and use API keys with limited scopes for automation.
Future Trends
By 2026 the Elastic Stack is expected to integrate deeper with observability standards such as OpenTelemetry, offering native trace and metric correlation alongside logs. Automated schema inference and AI‑driven anomaly detection will reduce manual pipeline configuration, while serverless ingestion options will simplify scaling for bursty workloads.
Conclusion
A thoughtfully engineered Elastic Stack architecture delivers a powerful, scalable foundation for log analytics that can grow from a single node to a multi‑region cluster. By leveraging its modular components, organizations can build resilient pipelines, gain real time insights, and future proof their observability stack for emerging data formats and AI‑enhanced analysis.