Observability Stack: Unifying Metrics, Logs, and Traces
Introduction
Modern distributed systems generate massive amounts of data. Teams that rely on separate tools for metrics, logs, and traces often struggle with fragmented insight, delayed detection, and costly manual correlation. An observability stack that brings these three pillars together offers a holistic view of system health, enabling faster root cause analysis and more confident decision making.
Core Concept
Observability is the ability to infer the internal state of a system based on external outputs. Metrics provide quantitative measurements over time, logs capture detailed event records, and traces follow the path of individual requests across service boundaries. When combined, they create a rich, multidimensional picture that is greater than the sum of its parts.
Architecture Overview
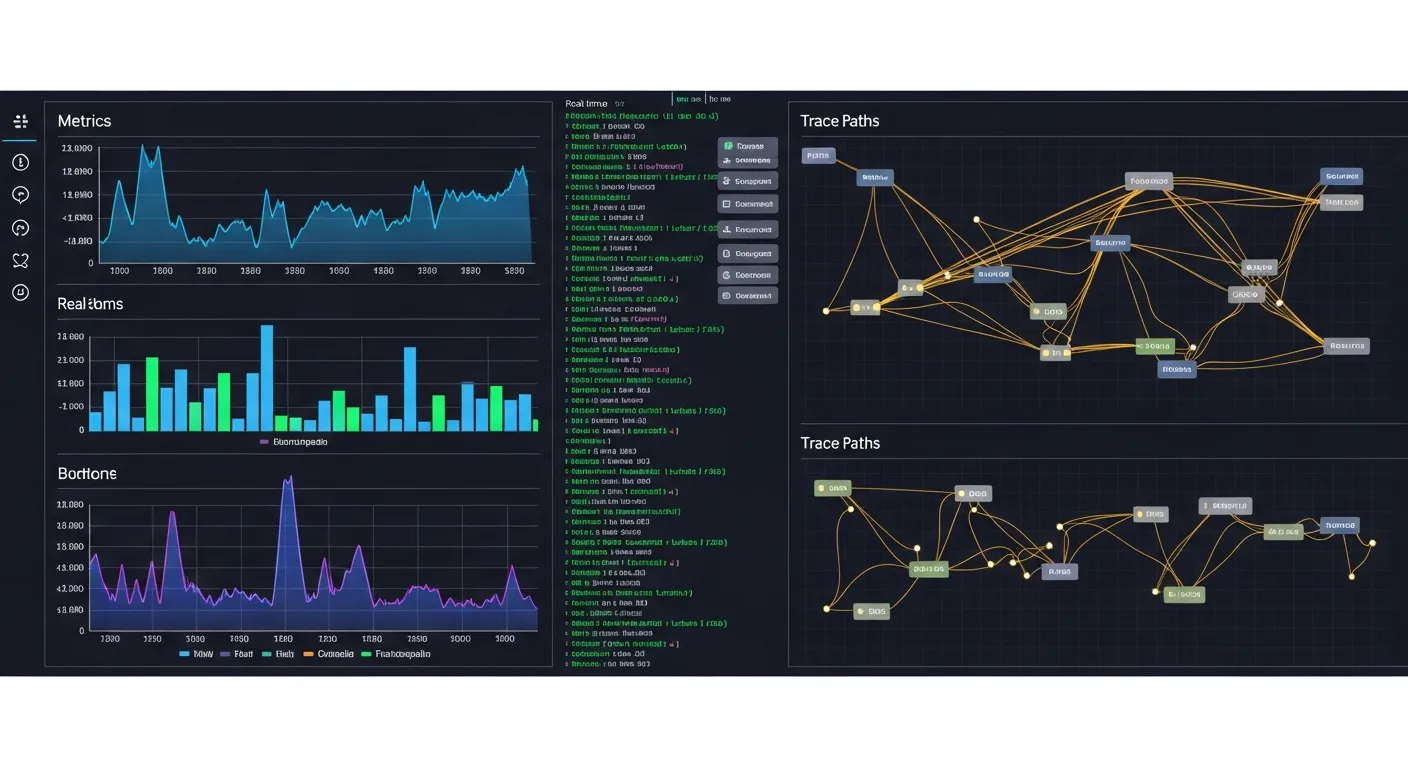
A typical observability stack consists of data collection agents, a central data pipeline, storage backends optimized for each data type, a correlation engine that links related events, and visualization dashboards that expose unified queries. The stack is usually built on open standards such as OpenTelemetry for instrumentation and on scalable cloud native platforms for processing and retention.
Key Components
- Metrics collector
- Log aggregator
- Distributed tracer
- Correlation engine
- Visualization dashboard
How It Works
Instrumentation libraries emit metric points, log entries, and trace spans to local agents. These agents batch and forward data to a central pipeline that normalizes formats, enriches with metadata, and stores each type in a purpose‑built backend. The correlation engine uses identifiers such as trace IDs to stitch logs and metrics to the corresponding trace, allowing a single query to retrieve all relevant data for a request. Users interact with the dashboard to explore time series, search logs, and view end‑to‑end request flows in one interface.
Use Cases
- Root cause analysis of latency spikes
- Capacity planning and scaling decisions
- Security incident forensics
Advantages
- Unified view reduces context switching for engineers
- Correlated data accelerates troubleshooting and reduces MTTR
- Proactive alerts based on combined signals improve reliability
Limitations
- Increased storage cost due to retaining multiple data types
- Complexity of data correlation across heterogeneous services
Comparison
Compared to siloed monitoring solutions, a combined observability stack provides end‑to‑end visibility, while traditional tools often require manual data stitching and cannot trace a request across services. The integrated approach eliminates gaps that lead to blind spots and speeds up incident resolution.
Performance Considerations
High‑volume environments must balance data fidelity with storage and processing overhead. Techniques such as metric down‑sampling, log retention policies, and trace sampling help control cost. Choosing appropriate backends—time series databases for metrics, indexed storage for logs, and columnar stores for traces—optimizes query latency. Network bandwidth and agent resource usage also need monitoring to avoid impacting the workloads being observed.
Security Considerations
Observability data may contain sensitive information, so encryption in transit and at rest is essential. Role‑based access control should limit who can view raw logs or trace details. Auditing access to observability pipelines helps meet compliance requirements such as GDPR or HIPAA. Masking or redacting personally identifiable data before ingestion is a best practice.
Future Trends
By 2026 the observability landscape is moving toward AI‑driven anomaly detection, automated root cause suggestions, and observability as code where pipelines are defined declaratively. OpenTelemetry will become the universal standard for all three pillars, simplifying vendor lock‑in. Edge computing will push observability agents closer to devices, requiring lightweight data processing and federated aggregation models.
Conclusion
Combining metrics, logs, and traces into a single observability stack transforms raw data into actionable insight. While it introduces storage and operational complexity, the benefits of faster debugging, proactive reliability, and deeper system understanding outweigh the costs. Organizations that adopt an integrated observability approach are better positioned to manage the growing scale and dynamism of modern cloud native applications.