OpenTelemetry Explained: Boost Your Observability Strategy
Introduction
In modern cloud-native environments the volume of services and interactions makes it impossible to rely on isolated logs or manual checks. Observability—collecting traces, metrics and logs in a unified way—has become essential for maintaining reliability and performance.
Core Concept
OpenTelemetry is an open source, vendor-neutral framework that standardizes the generation, collection, and export of telemetry data across applications, services and infrastructure.
Architecture Overview
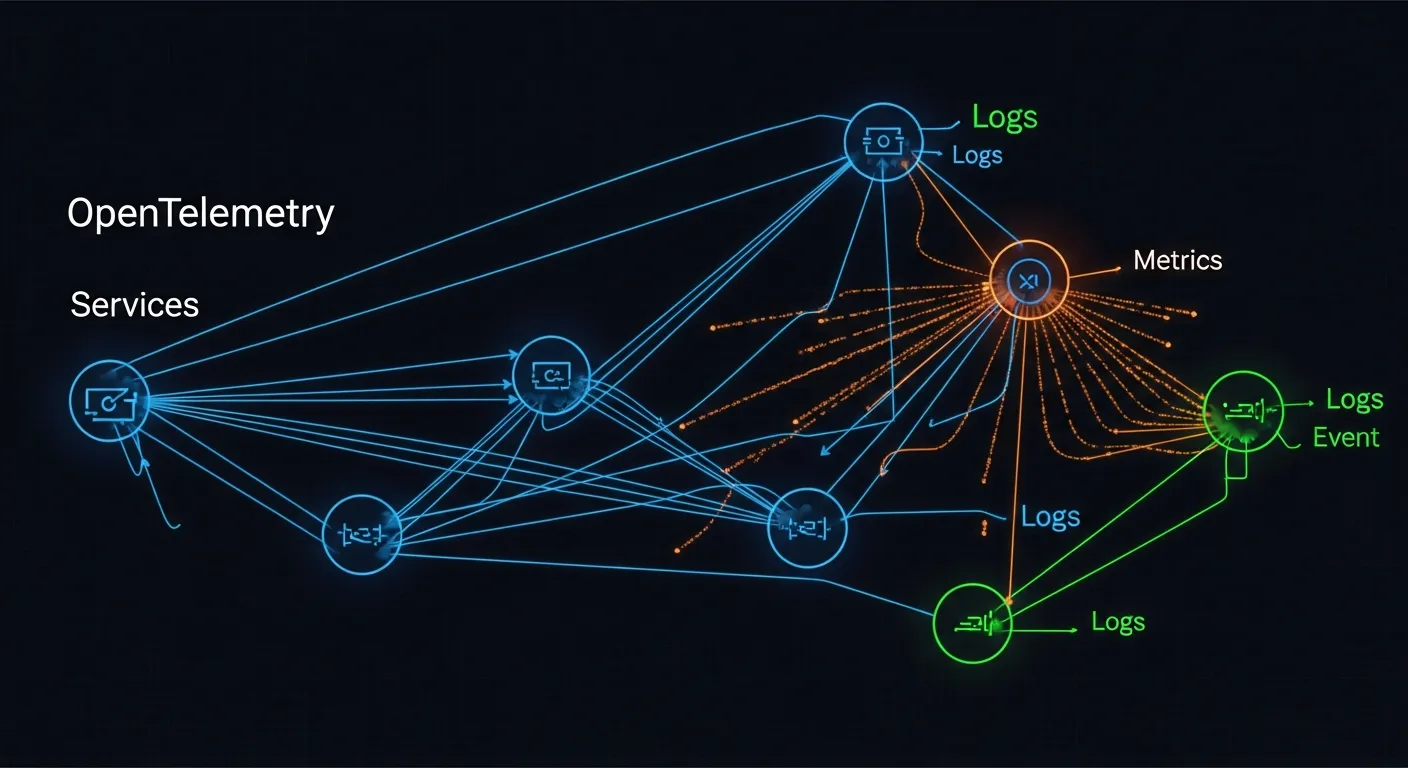
The OpenTelemetry architecture consists of three layers: the instrumentation SDK embedded in code, the Collector that aggregates and processes data, and the exporters that forward telemetry to backend analysis platforms. This layered design enables consistent data handling from source to storage.
Key Components
- Instrumentation SDK
- Collector
- Exporters
- Backend analysis tools
How It Works
Developers add SDK calls or use auto-instrumentation libraries to generate spans, metrics and logs. The SDK formats data according to the OpenTelemetry protocol and sends it to a locally or remotely deployed Collector. The Collector can batch, filter, transform and enrich data before routing it through exporters to observability backends such as Prometheus, Jaeger or commercial SaaS solutions.
Use Cases
- Root cause analysis of latency spikes in microservice architectures
- Real‑time performance dashboards for serverless functions
Advantages
- Vendor agnostic data format reduces lock‑in risk
- Single unified API for traces, metrics and logs
- Extensible Collector pipelines for custom processing
- Strong community support and rapid evolution
Limitations
- Initial instrumentation effort for legacy codebases
- Configuration complexity of Collector pipelines can be steep
- Limited out‑of‑the‑box support for some proprietary protocols
Comparison
Compared with older solutions like OpenTracing or OpenCensus, OpenTelemetry merges tracing and metrics into one spec, simplifying implementation. Proprietary agents from cloud providers offer tighter integration but sacrifice portability, while OpenTelemetry maintains a neutral standard that works across clouds and on‑prem environments.
Performance Considerations
The Collector adds a processing layer that can introduce latency if not tuned; using batch processors and appropriate sampling rates helps keep overhead low. Exporter selection also impacts network usage, so compressing payloads and leveraging local aggregation are recommended best practices.
Security Considerations
Telemetry data may contain sensitive identifiers; encrypting traffic between SDKs, Collector and backends using TLS is mandatory. Role‑based access control on Collector endpoints and careful scrubbing of PII during processing further protect data privacy.
Future Trends
By 2026 OpenTelemetry is expected to expand into automated anomaly detection, tighter integration with AI‑driven observability platforms, and standardized support for emerging protocols such as eBPF‑based tracing, making it the backbone of self‑healing cloud systems.
Conclusion
OpenTelemetry provides a comprehensive, open framework that unifies the three pillars of observability. By adopting its standards, organizations can achieve deeper insight, avoid vendor lock‑in and future‑proof their monitoring stack as cloud architectures continue to evolve.