Understanding OpenTelemetry Data Pipelines: A Complete Guide
Introduction
Observability has become a cornerstone of modern cloud-native applications. OpenTelemetry, the unified standard for traces, metrics, and logs, provides the tools to capture telemetry at scale. This article demystifies the data pipeline that moves raw signals from instrumented code to back‑end analysis platforms, helping architects design reliable, performant, and secure observability solutions.
Core Concept
At its core, an OpenTelemetry data pipeline is a series of stages that transform raw telemetry into structured, enriched data ready for storage and analysis. The pipeline starts with instrumentation in the application, passes through in‑process collection, optional processing, and finally an exporter that sends data to a backend such as Jaeger, Prometheus, or a commercial observability service.
Architecture Overview
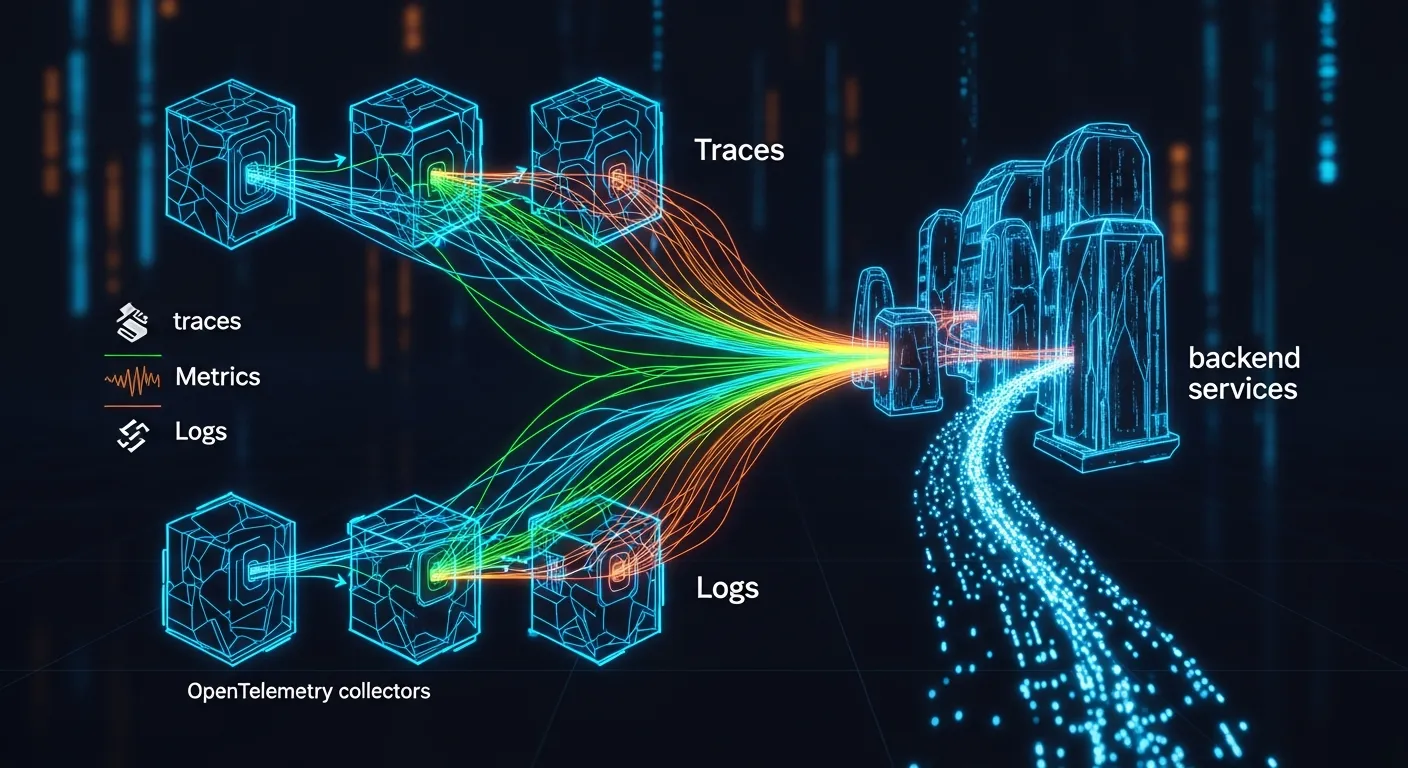
The typical pipeline consists of four layers: instrumentation libraries, the OpenTelemetry SDK, the Collector, and the backend. Instrumentation libraries embed trace and metric calls directly in code. The SDK provides in‑process processing, context propagation, and sampling. The OpenTelemetry Collector acts as a centralized agent or gateway, handling batching, transformation, and export. Finally, the backend stores and visualizes the data. Each layer can be independently configured, allowing flexible deployment models from sidecar agents to hosted collectors.
Key Components
- Instrumentation libraries
- OpenTelemetry SDK
- OpenTelemetry Collector
- Exporters
- Processors
- Receivers
How It Works
When an application emits a span or metric, the instrumentation library creates a telemetry object and passes it to the SDK. The SDK applies sampling rules, adds resource attributes, and queues the data in a thread‑safe buffer. If a local exporter is configured, the SDK sends the data directly to the backend; otherwise it forwards the data to the Collector via a receiver protocol such as OTLP over gRPC or HTTP. The Collector can apply processors for batching, attribute enrichment, or filtering before routing the data to one or more exporters. Exporters translate the data into the format required by the target backend and transmit it over the network. Throughout the flow, context propagation ensures that traces remain linked across service boundaries.
Use Cases
- Full‑stack distributed tracing for microservice architectures
- Real‑time metric aggregation for autoscaling decisions
- Log correlation with traces and metrics for root‑cause analysis
- Multi‑tenant observability platforms that isolate data per customer
Advantages
- Vendor neutral standard reduces lock‑in
- Modular pipeline enables incremental adoption
- Built‑in support for batching and compression improves network efficiency
- Extensible processors allow custom enrichment without code changes
Limitations
- Complex configuration can be error‑prone for large deployments
- High cardinality attributes may increase storage costs
- Latency introduced by batching may not suit ultra‑low‑delay monitoring
Comparison
Compared with legacy agents like Zipkin or Prometheus exporters, OpenTelemetry offers a unified model for traces, metrics, and logs, reducing the need for multiple instrumentations. Unlike proprietary SDKs, it provides a single API that works across languages and platforms, while still allowing custom exporters to integrate with existing tools.
Performance Considerations
Key factors include sampling rate, batch size, and transport protocol. Lower sampling reduces CPU overhead but may miss rare events. Larger batches improve throughput but increase latency. OTLP over gRPC typically outperforms HTTP/JSON in high‑throughput scenarios. Monitoring the collector's queue depth helps avoid back‑pressure that could drop data.
Security Considerations
Telemetry often contains sensitive identifiers. Use mutual TLS for OTLP connections to encrypt data in transit. Apply attribute scrubbing processors to remove PII before export. Role‑based access control on the collector and backend ensures that only authorized services can publish or read data.
Future Trends
By 2026 the OpenTelemetry ecosystem will likely converge on native support for AI‑driven anomaly detection, with collectors offering built‑in model inference. Edge deployments will use lightweight WASM processors for on‑device enrichment, and standardized semantic conventions will expand to cover emerging domains such as serverless functions and quantum workloads.
Conclusion
OpenTelemetry data pipelines provide a flexible, vendor‑agnostic foundation for modern observability. By understanding each stage—from instrumentation to export—architects can design pipelines that balance performance, security, and cost while future‑proofing their systems for evolving monitoring needs.